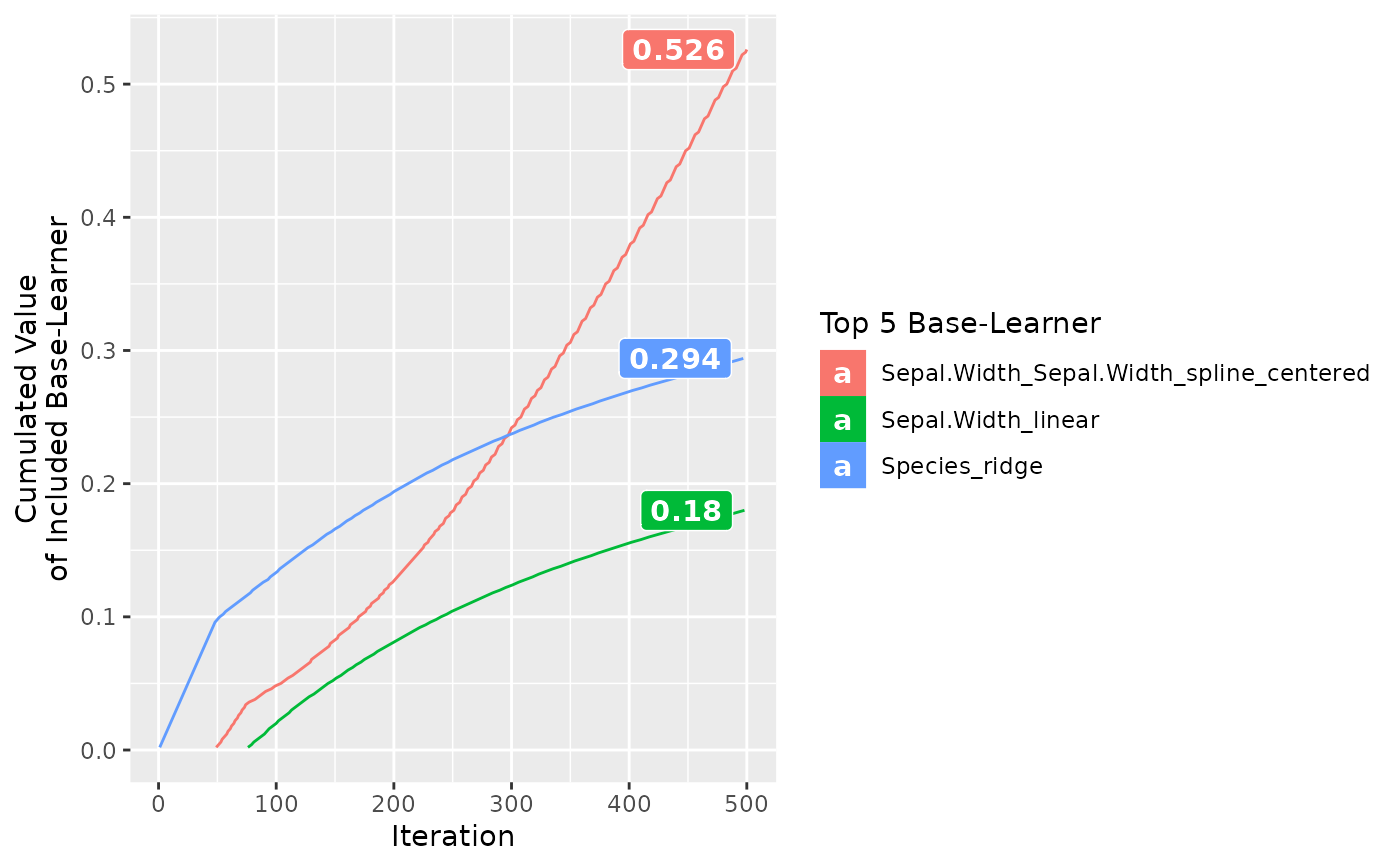
This function shows how the base learners evolves over the fitting process.
The default is to show how the frequency of a single base learner included
into the model evolves. Additionally, with the value argument, vectors
(e.g. the risk) can be used to show how the base learner specific risk reduction
evolves during the fitting process.
Examples
cboost = Compboost$new(data = iris, target = "Petal.Length",
 loss = LossQuadratic$new())
cboost$addComponents("Sepal.Width")
cboost$addBaselearner("Species", "ridge", BaselearnerCategoricalRidge)
cboost$train(500L)
#>   1/500   risk = 1.4
#>  12/500   risk = 0.52
#>  24/500   risk = 0.21
#>  36/500   risk = 0.13
#>  48/500   risk = 0.1
#>  60/500   risk = 0.093
#>  72/500   risk = 0.088
#>  84/500   risk = 0.085
#>  96/500   risk = 0.083
#> 108/500   risk = 0.081
#> 120/500   risk = 0.079
#> 132/500   risk = 0.078
#> 144/500   risk = 0.077
#> 156/500   risk = 0.076
#> 168/500   risk = 0.075
#> 180/500   risk = 0.074
#> 192/500   risk = 0.074
#> 204/500   risk = 0.073
#> 216/500   risk = 0.073
#> 228/500   risk = 0.072
#> 240/500   risk = 0.072
#> 252/500   risk = 0.072
#> 264/500   risk = 0.071
#> 276/500   risk = 0.071
#> 288/500   risk = 0.071
#> 300/500   risk = 0.071
#> 312/500   risk = 0.071
#> 324/500   risk = 0.07
#> 336/500   risk = 0.07
#> 348/500   risk = 0.07
#> 360/500   risk = 0.07
#> 372/500   risk = 0.07
#> 384/500   risk = 0.07
#> 396/500   risk = 0.069
#> 408/500   risk = 0.069
#> 420/500   risk = 0.069
#> 432/500   risk = 0.069
#> 444/500   risk = 0.069
#> 456/500   risk = 0.069
#> 468/500   risk = 0.069
#> 480/500   risk = 0.069
#> 492/500   risk = 0.069
#>
#>
#> Train 500 iterations in 0 Seconds.
#> Final risk based on the train set: 0.069
#>
plotBaselearnerTraces(cboost)