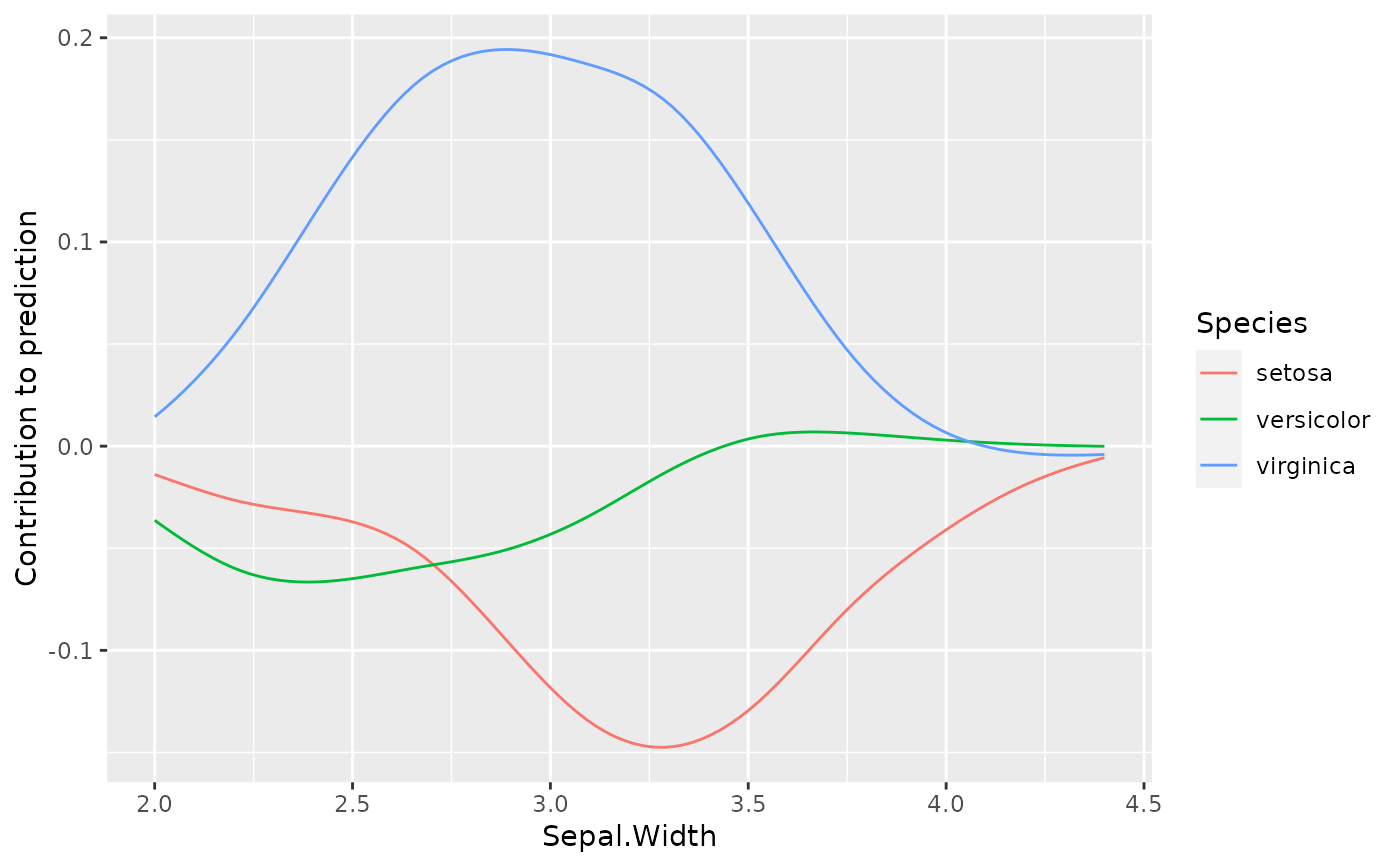
This function visualizes the contribution of a bivariate tensor product.
Arguments
- cboost
(Compboost)
A trainedCompboostobject.- tname
(
character(2L))
Name of the tensor base learner.- npoints
(
integer(1L))
Number of grid points per numerical feature. Note: For two numerical features, the overall number of grid points isnpoints^2. For a numerical and categorical feature it isnpoints * ncatwithncatthe number of categories. For two categorical featuresncat^2grid points are drawn.- nbins
(
logical(1L))
Number of bins for the surface. Only applies in the case of two numerical features. A smooth surface is drawn ifnbins = NULL.
Examples
# \donttest{
cboost = Compboost$new(data = iris, target = "Petal.Length",
  learning_rate = 0.1)

cboost$addTensor("Sepal.Width", "Sepal.Length", df1 = 4, df2 = 4, n_knots = 10)
cboost$addTensor("Sepal.Width", "Species", df1 = 4, df2 = 2, n_knots = 10)

cboost$train(100L)
#>   1/100   risk = 1.3
#>   2/100   risk = 1.1
#>   4/100   risk = 0.77
#>   6/100   risk = 0.56
#>   8/100   risk = 0.43
#>  10/100   risk = 0.34
#>  12/100   risk = 0.28
#>  14/100   risk = 0.24
#>  16/100   risk = 0.21
#>  18/100   risk = 0.19
#>  20/100   risk = 0.18
#>  22/100   risk = 0.17
#>  24/100   risk = 0.17
#>  26/100   risk = 0.16
#>  28/100   risk = 0.16
#>  30/100   risk = 0.16
#>  32/100   risk = 0.15
#>  34/100   risk = 0.15
#>  36/100   risk = 0.15
#>  38/100   risk = 0.15
#>  40/100   risk = 0.15
#>  42/100   risk = 0.15
#>  44/100   risk = 0.15
#>  46/100   risk = 0.14
#>  48/100   risk = 0.14
#>  50/100   risk = 0.14
#>  52/100   risk = 0.14
#>  54/100   risk = 0.14
#>  56/100   risk = 0.14
#>  58/100   risk = 0.14
#>  60/100   risk = 0.14
#>  62/100   risk = 0.13
#>  64/100   risk = 0.13
#>  66/100   risk = 0.13
#>  68/100   risk = 0.13
#>  70/100   risk = 0.13
#>  72/100   risk = 0.13
#>  74/100   risk = 0.13
#>  76/100   risk = 0.13
#>  78/100   risk = 0.13
#>  80/100   risk = 0.13
#>  82/100   risk = 0.13
#>  84/100   risk = 0.13
#>  86/100   risk = 0.12
#>  88/100   risk = 0.12
#>  90/100   risk = 0.12
#>  92/100   risk = 0.12
#>  94/100   risk = 0.12
#>  96/100   risk = 0.12
#>  98/100   risk = 0.12
#> 100/100   risk = 0.12
#>
#>
#> Train 100 iterations in 0 Seconds.
#> Final risk based on the train set: 0.12
#>

plotTensor(cboost, "Sepal.Width_Species_tensor")

plotTensor(cboost, "Sepal.Width_Sepal.Length_tensor")

# }
# }