This function visualizes the contribution of a base learner to the overall
prediction score. For visualization of partial effects see plotPEUni().
Examples
cboost = Compboost$new(data = iris, target = "Petal.Length",
loss = LossQuadratic$new())
cboost$addComponents("Sepal.Width")
cboost$train(500L)
#> 1/500 risk = 1.5
#> 12/500 risk = 1.3
#> 24/500 risk = 1.2
#> 36/500 risk = 1.2
#> 48/500 risk = 1.1
#> 60/500 risk = 1.1
#> 72/500 risk = 1.1
#> 84/500 risk = 1.1
#> 96/500 risk = 1.1
#> 108/500 risk = 1.1
#> 120/500 risk = 1.1
#> 132/500 risk = 1.1
#> 144/500 risk = 1.1
#> 156/500 risk = 1.1
#> 168/500 risk = 1.1
#> 180/500 risk = 1.1
#> 192/500 risk = 1
#> 204/500 risk = 1
#> 216/500 risk = 1
#> 228/500 risk = 1
#> 240/500 risk = 1
#> 252/500 risk = 1
#> 264/500 risk = 1
#> 276/500 risk = 1
#> 288/500 risk = 1
#> 300/500 risk = 1
#> 312/500 risk = 1
#> 324/500 risk = 1
#> 336/500 risk = 1
#> 348/500 risk = 1
#> 360/500 risk = 1
#> 372/500 risk = 1
#> 384/500 risk = 1
#> 396/500 risk = 1
#> 408/500 risk = 1
#> 420/500 risk = 1
#> 432/500 risk = 1
#> 444/500 risk = 1
#> 456/500 risk = 1
#> 468/500 risk = 1
#> 480/500 risk = 1
#> 492/500 risk = 1
#>
#>
#> Train 500 iterations in 0 Seconds.
#> Final risk based on the train set: 1
#>
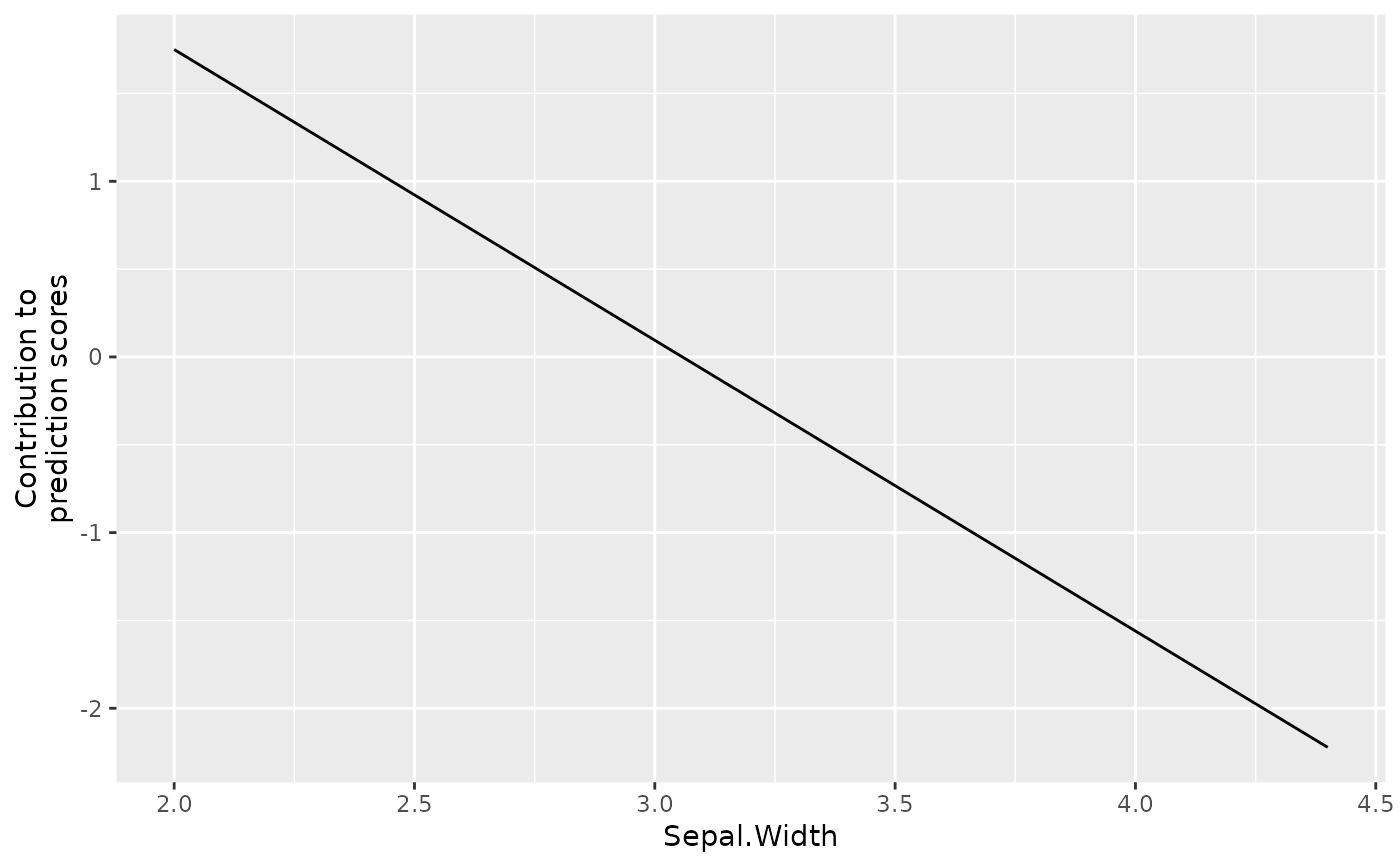
plotBaselearner(cboost, "Sepal.Width_linear")
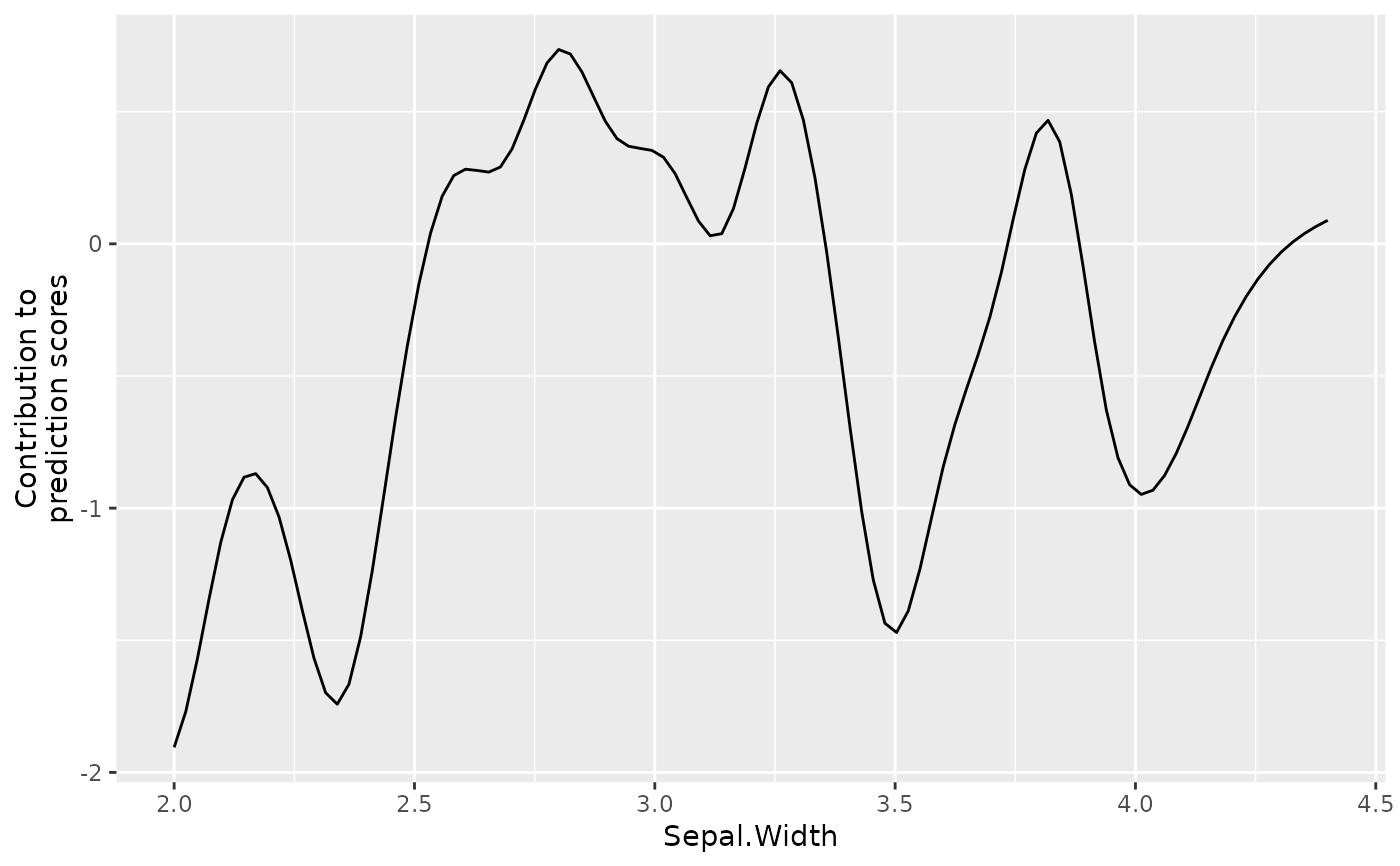
 plotBaselearner(cboost, "Sepal.Width_Sepal.Width_spline_centered")