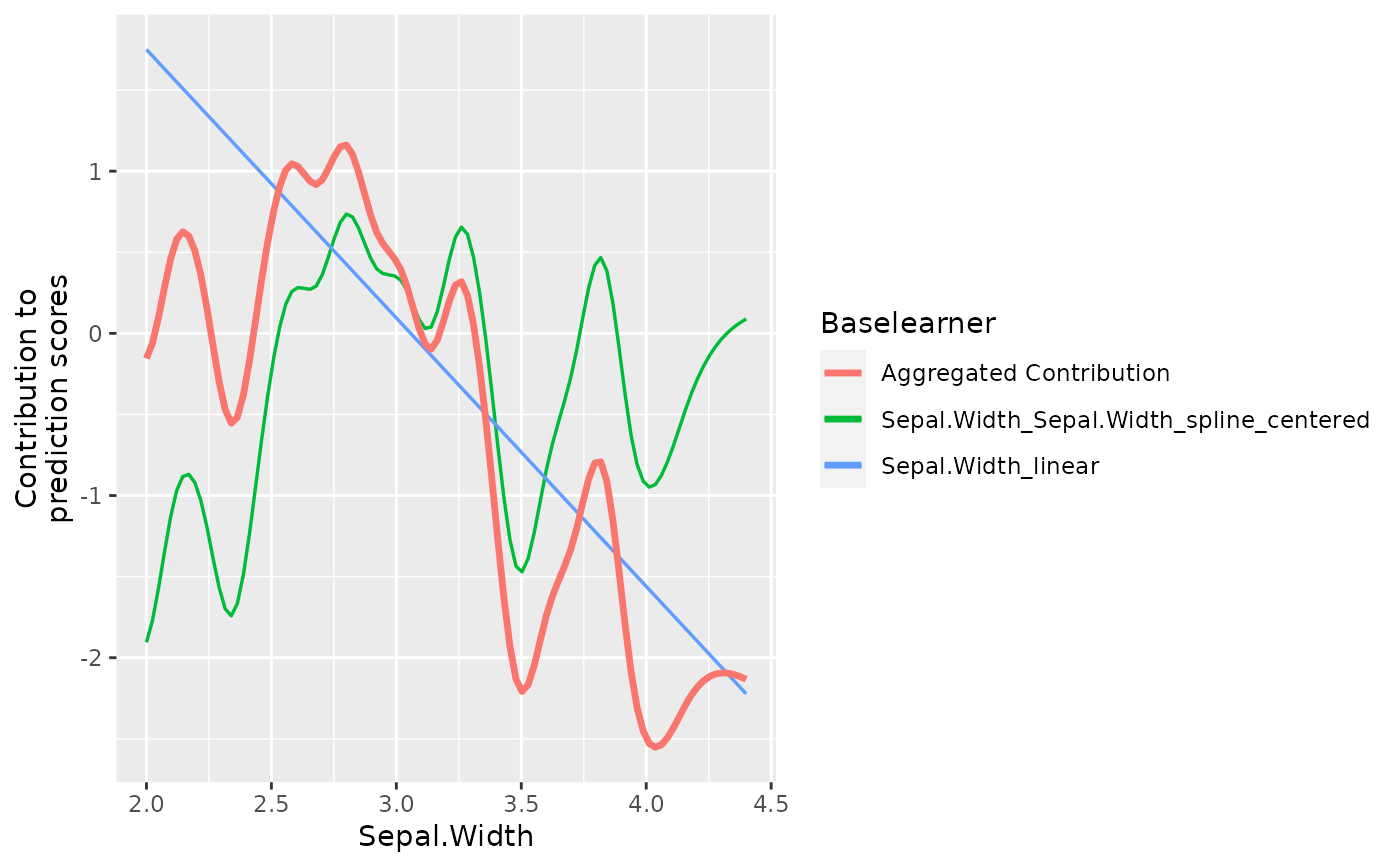
This function visualizes the contribution of a specific feature to the overall
prediction score. If multiple base learner of the same features are included,
they are all added to the graphic as well as the aggregated contribution. The
difference to plotBaselearner() is that potentially multiple base learners
that are based on feat are aggregated and visualized while plotBaselearner()
only visualizes the contribution of one specific base learner. The function
also automatically decides whether the given feature is numeric or categorical and
chooses an appropriate technique (lines for numeric and horizontal lines for categorical).
Arguments
- cboost
- feat
(
character(1L))
Name of the feature.- npoints
(
integer(1L))
Number of points which are predicted for the lines (only applies to numerical features).- individual
(
logical(1L))
Flag whether individual base learners should be added to the graphic or not.
Examples
cboost = Compboost$new(data = iris, target = "Petal.Length",
  loss = LossQuadratic$new())
cboost$addComponents("Sepal.Width")
cboost$train(500L)
#>   1/500   risk = 1.5
#>  12/500   risk = 1.3
#>  24/500   risk = 1.2
#>  36/500   risk = 1.2
#>  48/500   risk = 1.1
#>  60/500   risk = 1.1
#>  72/500   risk = 1.1
#>  84/500   risk = 1.1
#>  96/500   risk = 1.1
#> 108/500   risk = 1.1
#> 120/500   risk = 1.1
#> 132/500   risk = 1.1
#> 144/500   risk = 1.1
#> 156/500   risk = 1.1
#> 168/500   risk = 1.1
#> 180/500   risk = 1.1
#> 192/500   risk = 1
#> 204/500   risk = 1
#> 216/500   risk = 1
#> 228/500   risk = 1
#> 240/500   risk = 1
#> 252/500   risk = 1
#> 264/500   risk = 1
#> 276/500   risk = 1
#> 288/500   risk = 1
#> 300/500   risk = 1
#> 312/500   risk = 1
#> 324/500   risk = 1
#> 336/500   risk = 1
#> 348/500   risk = 1
#> 360/500   risk = 1
#> 372/500   risk = 1
#> 384/500   risk = 1
#> 396/500   risk = 1
#> 408/500   risk = 1
#> 420/500   risk = 1
#> 432/500   risk = 1
#> 444/500   risk = 1
#> 456/500   risk = 1
#> 468/500   risk = 1
#> 480/500   risk = 1
#> 492/500   risk = 1
#>
#>
#> Train 500 iterations in 0 Seconds.
#> Final risk based on the train set: 1
#>
plotPEUni(cboost, "Sepal.Width")